Power Tips #117: Measure your LLC resonant tank before testing at full operating conditions
- Analog
- 2023-09-23 21:19:51
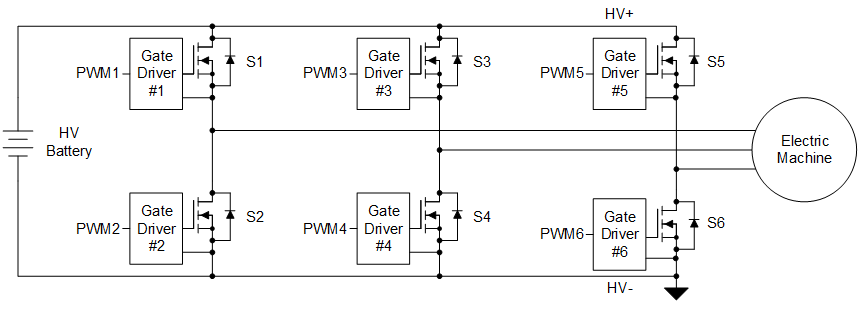
Half-bridge series resonant converters achieve high efficiencies and high power densities for converters over 100 W. The most common resonant topology (Figure 1) is a resonant tank comprised of a series magnetizing inductor; resonant inductor; and a capacitor (abbreviated as LLC). The selection of parameter values determines the shape of the resonant tank’s gain curve, which affects how the resonant converter performs in a system.
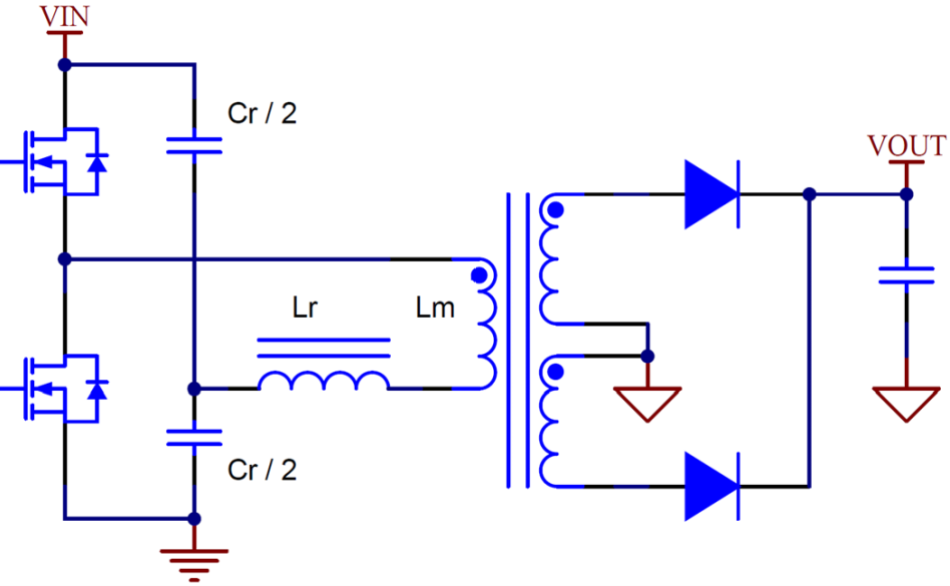
Figure 1 A half-bridge LLC power-stage with split resonant capacitors, the selection of parameter values determines the shape of the resonant tank’s gain curve which needs to be verified before applying energy to the circuit. Source:Texas Instruments
Once you have settled on a set of parameters and selected the components, it is very important to verify the gain curve before applying energy to the circuit. In this power tip I will describe a technique for measuring a resonant tank’s gain curve and how to interpret the results, including examples that show both the strengths and limitations of this technique.


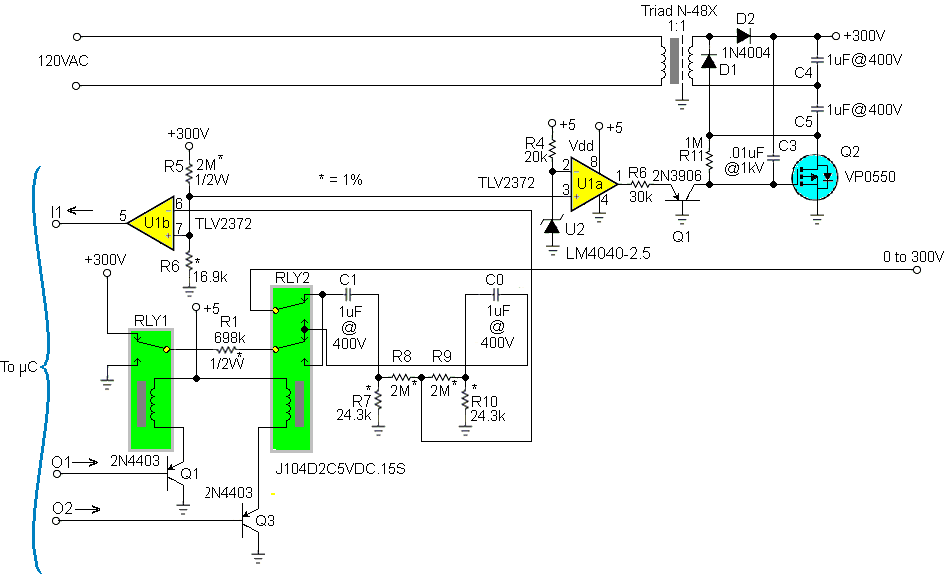
A frequency response analyzer injects a small AC signal to any circuit, then measures the voltages at two points in the system to determine the signal gain and phase delay across a determined frequency range. While this equipment is most commonly used for testing a control loop, you can also use a frequency response analyzer to measure the gain of the power stage of an LLC converter. Figure 2 shows the wiring diagram for such a measurement.

Figure 2 Wiring diagram for connecting a resonant tank to a frequency response analyzer to recreate gain curve plots. The gain plot of the power stage can be obtained by displaying the magnitude of channel 2’s voltage divided by channel 1’s voltage. Source: Texas Instruments
The half-bridge LLC has a pair of resonant capacitors, with one tied to the input voltage and the other tied to primary ground. To run the test in this circuit, the resonant capacitors must be in parallel with each other and in series with the primary winding. The injection signal and channel 1 measurement of the analyzer connect across the primary-side components from the switching node of the half bridge to the other end of the resonant capacitors. The secondary channel of the analyzer, channel 2, connects across the secondary winding, with a resistor added to approximate the loading conditions. After sweeping the frequency of the injected AC signal, you can plot the gain of the power stage by displaying the magnitude of channel 2’s voltage divided by channel 1’s voltage. Figure 3 shows an example test result.

Figure 3 A sample LLC resonant tank gain curve measurement that can be observed from the test setup shown in Figure 2. Source: Texas Instruments
You can convert the power-stage gain to a voltage gain depending on the transformer turns ratio and the configuration of switches and windings on the primary and secondary sides of the power stage. A half-bridge LLC power stage is typically shown with a center-tapped secondary winding and two output rectifiers. In this example, the output voltage is approximately the product of the input voltage, turns ratio, and gain of the resonant tank at the operating frequency. Other options for secondary configurations drawn in Figure 4 enable the resonant tank to convert to higher output voltages. Note that if the primary side is configured with a full bridge, you will need to multiply these ratios by a factor of two.

Figure 4 Configuring the secondary-side with a full-wave rectifier doubles the transferred energy (a); a double-ended secondary configuration achieves a fourfold voltage gain (b). Source: Texas Instruments
A benefit to this technique is that you can take the measurement directly on the PCB and account for power-stage parasitic elements in the test results. The TI E2E™ design support forums article, “Why is Your LLC Resonant Converter Frequency Way, Way Off,” uses an alternate model to explain how the construction of the transformer introduces additional inductances into the circuit (Figure 5). You can design around these inherent parasitic components or integrate them into your design. For example, you can use the leakage inductance as the resonant inductor, which saves cost and improves efficiency by removing a physical component from the design. It’s possible to simplify the optimization of a resonant tank design with this method by using this quick test.

Figure 5 Transformer model using leakage inductance as a resonant element for an LLC converter, allowing designers to either design around inherent parasitic components or integrate them into the design. Source: Texas Instruments
Using synchronous rectifiers on the secondary will further improve the LLC converter efficiency. Doing so will lower conduction losses, which tend to dominate the total loss characteristic for that component; however, the choice of MOSFETs can change the shape of the gain curve. Lower-resistance MOSFETs will have a larger output capacitance. The turns ratio of the transformer can amplify this capacitance, which can then become an issue in some cases. As I mentioned, testing the gain curve in circuit helps account for additional parasitic elements throughout the power stage. Figure 6 highlights the effects of MOSFET output capacitance that may have gone unnoticed in the initial resonant tank design.

Figure 6 In this design, parasitic capacitance added a resonance at around 300 kHz that was not intended to be there in the design phase. Source: Texas Instruments
However, using a frequency response analyzer cannot account for all design parasitic elements. For example, the measurement will not show the effects of secondary windings that are not well-coupled to each other on a center-tap structure. Loose couplings between the primary and secondary windings will form leakage inductance, and this is beneficial to an extent in LLC designs. Secondary windings that are not well-coupled to each other will decrease the performance of the power stage, however. It is not possible to observe the effects of this in AC analysis, but it will be apparent when monitoring the secondary winding voltages.
For example, the design in Figure 7 had a correct gain curve. But when looking at the voltage across the secondary windings, the level started out higher and drooped to a level lower than the output voltage. Ideally, these voltage waveforms should look more like a square wave. Loose coupling also creates a large leakage spike on the secondary rectifier turnoff edge. As the load increases, the distorted effects of the secondaries loosely coupled to each other become more noticeable and limit the possible output. power.

Figure 7 The loose coupling in a transformer design is noticeable in switching waveforms but was not apparent in its gain curve. Source: Texas Instruments
Even after reconfiguring this transformer design to have the secondary windings better coupled to each other, the resulting resonant inductance and magnetizing inductance remained the same. There was no visual difference in the gain curve measurements, as expected. But the switching waveforms in Figure 8 illustrated a noticeable improvement with the new design.

Figure 8 An improved transformer design with better coupling mitigated voltage droop while maintaining the gain curve shape. Source: Texas Instruments
With the secondary windings reconfigured, the switching waveforms look closer to expectations; the waveform is more square-shaped, with the blocking voltage equal to the output voltage. The leakage spike by the turnoff edge was also eliminated.
The two transformer designs were effectively the same, requiring no additional components. Yet the changes had a large impact on overall efficiency.
When designing a resonant converter, start your evaluation by validating the gain curve of the resonant tank. While it cannot detect all faults, you will get some insight into the achievable gain, as well as the expected operating frequency range.

John Dorosa is a Systems Engineer in Texas Instrument’s Power Design Services team focused on industrial applications and has developed over 100 unique SMPS reference design boards to meet custom power requirements.
Related Content
Power Tip #84 Think outside the LLC series resonant converter boxPower Tips #103: LLC design considerations for audio amplifiersPower Tips #89: High-frequency resonant converter design considerations, Part 1Power Tips #92: High-frequency resonant converter design considerations, Part 2Power Tips #97: Shape an LLC-SRC gain curve to meet battery charger needsAdditional resources
Power Tips: Get to know LLC series resonant converter designPower Tips: How much can a LLC series resonant converter do?Power Tips: Designing an LLC resonant half-bridge power converterPower Tips #117: Measure your LLC resonant tank before testing at full operating conditions由Voice of the EngineerAnalogColumn releasethank you for your recognition of Voice of the Engineer and for our original works As well as the favor of the article, you are very welcome to share it on your personal website or circle of friends, but please indicate the source of the article when reprinting it.“Power Tips #117: Measure your LLC resonant tank before testing at full operating conditions”