Load level versus power efficiency: Not always easy to figure
- LEDS
- 2023-09-23 23:13:32
Even simple, single-function products can start us thinking about bigger design issues. For instance, nearly all designers must cope with the challenge of providing a power supply that can function efficiently at both the average system power needs and also meet peak demands.
It’s often not easy, especially if the dynamic range of peak/average power requirement is large, as is the case in many situations. To help designers make their decisions, vendors of power regulators and converters often publish graphs of conversion efficiency versus load for a given device (Figure 1).
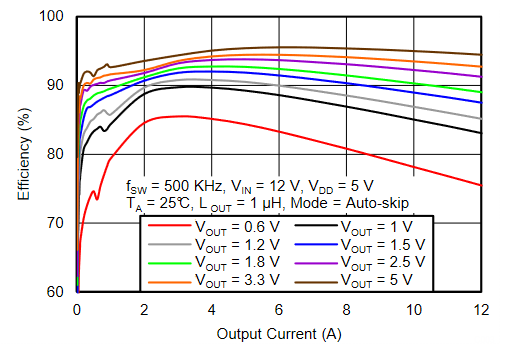
Figure 1 Vendors of power converters and regulators typically show their efficiency versus output current; here is the one for TI’s TPS53513 8-A synchronous buck converter. Source: Texas Instruments


But determining that range and the associated factor of how much of the operating cycle is spent in the various power modes is often not easy. I had a clear perspective of this design challenge when looking at my inexpensive, $15 AC-powered clock, Sharp SPC033A, and its four-digit, seven-segment LED display. If it seems I am spending way-too-much of my time clock-watching, it’s just that the clock is located where I often work and can easily see it (Figure 2).

Figure 2 Staring for too long at this low-cost Sharp AC-powered LED-display clock and the varying dimness of its display started my thinking journey. Source: Walmart
I noticed that the LED segments and digits flickered and dimmed, and the amount of flicker/dimming seemed to be related to how many of the digit segments were on. The display-related power load is a function of specific time (hours/minutes) being shown, meaning the number of individual digits and number of correction segments each requires (Figure 3).

Figure 3 Designers are very familiar with the widely used seven-segment numeric display and the relationship between number and position of energized segments and actual displayed digit. Source: Geeks for Geeks
For example, the least dimming occurred when the clock was showing 1:11 with just six energized segments (Figure 4).

Figure 4 Time 1:11 uses just six energized segments. Source: Geeks for Geeks
While it was more severe for the times when more segments where required, with displays such as 8:08 being the worst case requiring 20 energized segments (Figure 5).

Figure 5 Time 8:08 is a 20-segment time, as are other time-value displays. Source: Geeks for Geeks
I did a quick mental run-through estimate and concluded that most of the hour/minute time displays would require between 14 and 18 LED-digit segments being “on.” But that was just an estimate, so I started to write a small program to figure out how many segments were in use for each minute of the day, and then did a histogram plot of the results. At this point, I realized this modest query had taken on a life of its own, so I backed off. However, it would be a good question for a math contest, asking the entrants to develop the algorithm, code it, and plot the results for such a well-defined, almost equation-free question.
The display-driven power demands and associated dynamic range for this clock are fairly easy to quantify in advance. However, that’s not the case for many applications where the display is a function of the application and user actions, instead of being completely deterministic as it is in the case of the clock. One thing is clear: the load current and variations are a function of the displayed time, and also change at a fairly slow minute-by-minute pace.
I assume that the designers of this basic clock did not worry much about efficiency since the <5-W unit (about 10 years old) predates many regulatory mandates about efficiency even for lower-power AC devices. Of course, since it is AC powered, “run time” is a non-issue. However, for many designers of AC-powered and battery-powered devices, meeting these dual objectives requires a solid assessment of power use across different operating modes. Incidentally, this is the same clock which failed not long after my “idle-time thinking” about its power needs and displayed time; I replaced the supply capacitors and brought it back to life, as described in my post Would better electrolytic capacitors reduce e-waste?
Have you ever been challenged, had difficulty working out peak and average power requirements, or needed to establish basic power-supply design objectives? Have regulatory mandates made this more difficult, or actually given you more options?
Bill Schweber is an EE who has written three textbooks, hundreds of technical articles, opinion columns, and product features.
Related articles:
Would better electrolytic capacitors reduce e-waste?My seven-segment LED-dimming mysteryArrange LEDs as seven-segment displaysLEDing it hang out: The downside of higher efficiencyWhere’s your inefficiency?Load level versus power efficiency: Not always easy to figure由Voice of the EngineerLEDSColumn releasethank you for your recognition of Voice of the Engineer and for our original works As well as the favor of the article, you are very welcome to share it on your personal website or circle of friends, but please indicate the source of the article when reprinting it.“Load level versus power efficiency: Not always easy to figure”